Scientific Plotting Tools andAI AgentIn-Depth Technical Research
Evolution from Traditional Software to the MCP Agent Ecosystem: Exploring the Three-Layer Architecture and Future Trends of Academic Visualization
Introduction
Scientific plotting tools are undergoing a paradigm shift from traditional desktop software to AI-driven agents. The current ecosystem presents a three-layer architecture:Foundation Layer(Python/R programming, commercial software like Origin) ensures precision and controllability;Platform Layer(BioRender, Hiplot, etc.) lowers the barrier to professional visualization;Intelligence Layer(Multi-agent systems like PaperBanana, MCP protocol) enables automation and collaboration.
The core trend is"Human-AI Collaboration"—AI handles repetitive visual generation while humans focus on scientific judgment and creative decisions; the MCP protocol is becoming the key infrastructure connecting these layers.
Matplotlib/Seaborn/Plotly"] B --> B2["R Language Ecosystem
ggplot2"] B --> B3["Commercial Software
Origin/GraphPad"] C --> C1["Web Interactive Platforms
Hiplot/ChiPlot"] C --> C2["Professional Illustration Systems
BioRender/PicDoc"] C --> C3["Vector Design Tools
Illustrator/Inkscape"] D --> D1["Multi-Agent Systems
PaperBanana"] D --> D2["MCP Protocol
Standardized Interfaces"] D --> D3["AI Agent Skills
Automated Workflows"] style A fill:#1e293b,color:#ffffff,stroke:#475569,stroke-width:3px style B fill:#f1f5f9,color:#1e293b,stroke:#64748b,stroke-width:2px style C fill:#e2e8f0,color:#1e293b,stroke:#64748b,stroke-width:2px style D fill:#0f172a,color:#ffffff,stroke:#475569,stroke-width:2px
Data Visualization Tool Ecosystem
Programming Language Ecosystem
Python Visualization Stack
Matplotlib
Low-level plotting engine providing fine-grained control over 2D charts, supporting publication-quality output.
Seaborn
Advanced statistical visualization deeply integrated with Pandas, enabling one-click generation of complex statistical graphics like grouped violin plots.
Core Advantages:The competitiveness of the Python visualization stack lies inReproducibility—code serves as documentation, recording the entire plotting process in scripts. Combined with version control systems and Jupyter Notebook environments, it creates a transparent workflow from data exploration to result publication. [620]
R Language Visualization Ecosystem
ggplot2: Grammar of Graphics Theory
Built upon Leland Wilkinson's "Grammar of Graphics" theory, ggplot2 establishes alayered, declarative plotting systemthat deconstructs charts into seven independent layers: data, mapping, geometric objects, statistical transformations, coordinate systems, faceting, and themes. [619]
Extension Ecosystem
- • ggpubr: Publication-ready themes and statistical annotations
- • ggrepel: Solutions for overlapping labels
- • ggridges: Ridge plot implementation
- • gganimate: Dynamic visualization support
Statistical Specialization
- • Box plot notches indicating significance
- • QQ plot reference lines for normality testing
- • Scale-location diagnostics in residual plots
- • Dedicated visualizations for survival analysis
Commercial Desktop Software
Origin/OriginPro
Curve Fitting
200+ built-in functions and custom equations
- • Linear/polynomial/nonlinear least squares
- • Global fitting and parameter sharing
- • Parameter confidence interval output
Peak Analysis
Specialized modules for chromatography/spectroscopy data
- • Automatic peak detection and baseline correction
- • Multi-peak deconvolution
- • Area integration and quantitative analysis
Signal Processing
FFT and Wavelet Transform
- • Fast Fourier Transform
- • Wavelet denoising and filtering
- • Correlation analysis and convolution
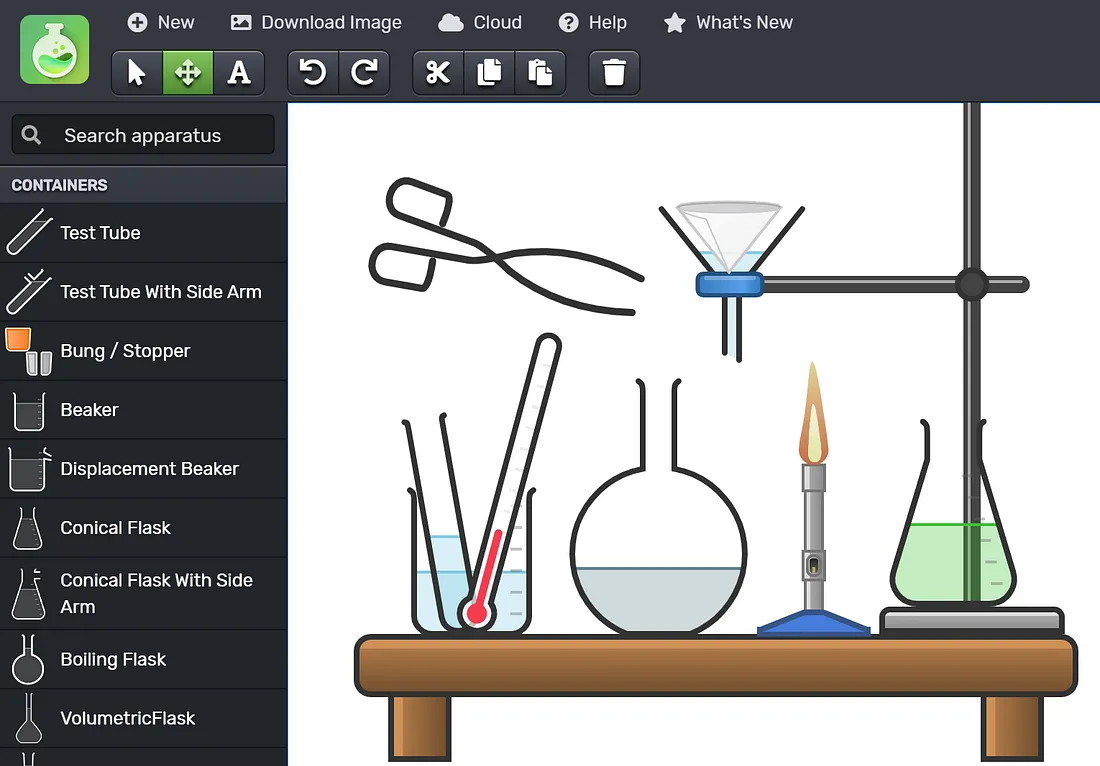
Web Interactive Platforms
Zero-Code Online Tools
Academic Illustration Creation System
Vector Graphic Design Tools
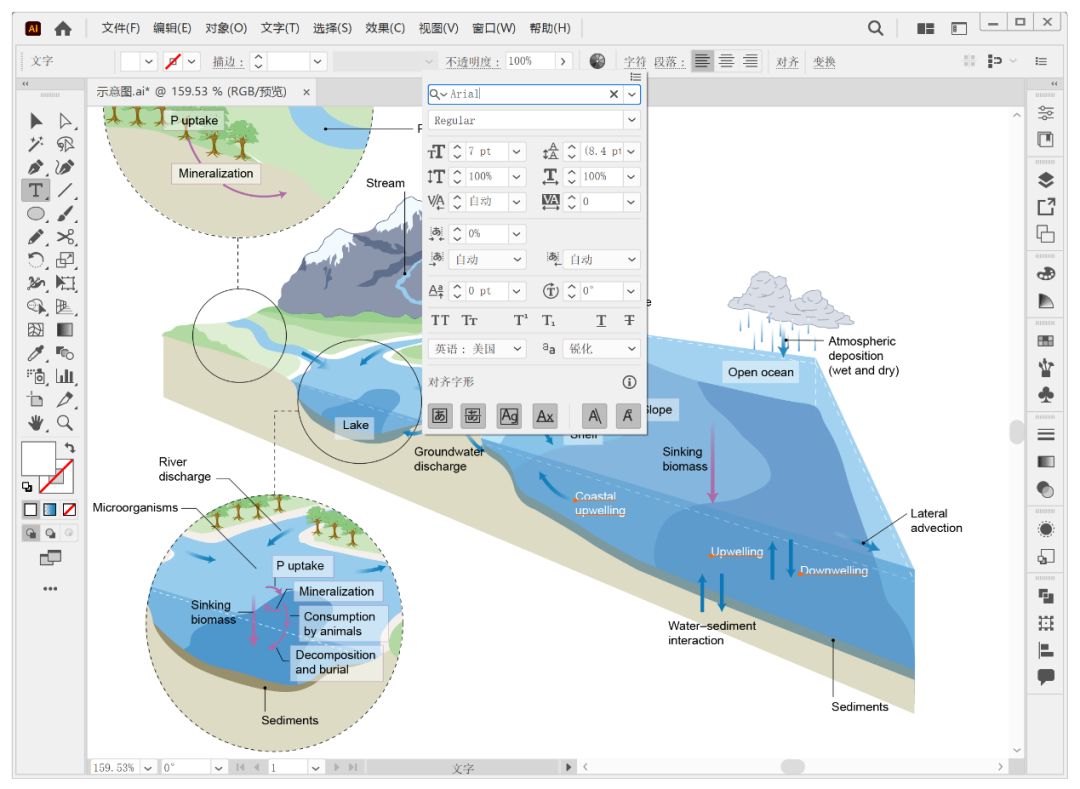
Adobe Illustrator
The"Ultimate Tool"in the field of scientific figure refinement, with core advantages lying in the infinite scalability of vector graphics and the integrity of the publication workflow. Print requirements for scientific papers typically demand resolutions above 300 dpi, while vector graphics describe elements via mathematical curves, maintaining sharp edges at any scale. [619]
Core Features
- • Pen Tool: Precise Bézier curve control
- • Pathfinder: Boolean operations for constructing complex shapes
- • Gradient Mesh: Simulating 3D depth
- • Swatches Tool: Color management and consistency
Typical Workflow
Basic plots generated by data tools → Refinement and assembly in Illustrator: unifying fonts, aligning axes, adjusting color schemes, adding annotations
Biomedical Professional Illustration Platforms
BioRender: Industry Standard Status
BioRender has established an"Industry Standard"status in the life sciences, officially recommended by top journals such as Cell, Nature, and Science. Its core assets include over 50,000 scientifically validated professional icons, covering cell membrane structures, viral particles, organelles, laboratory equipment, and more. [636] [646]
Core Advantages
- • Expert-reviewed icons ensuring scientific accuracy
- • Drag-and-drop modular interface
- • Top-journal template system and team collaboration features
- • Commercial licensing ensuring copyright compliance
PicDoc: Domestic AI Solution
Core Positioning"AI Text-to-Visual, Truly Zero Barrier", adopting a generative AI architecture that supports three input methods: text descriptions, PDF uploads, and template selection. [646]
Core Capabilities
- • Automatic layout for signaling pathway diagrams
- • 3D/2D rendering of cellular structures
- • Standardized Animal Experiment Protocols
- • Automatic Chart Type Selection for Data Visualization
Competitive Advantages
- • Deeply Optimized Chinese Semantic Understanding
- • Easy Access & Data Security
- • 6x+ Improvement in Drawing Efficiency
BioGDP: Asset Library + AI Hybrid Mode
Featuring10,000+ Original Hand-drawn Assetsand200+ Top Journal Templates, covering a wide range of scientific illustration needs, with official copyright authorization provided. [647]
Key Features
- • Top-Journal Aesthetics with Minimalist Chinese Interface
- • Official Copyright Authorization
- • Intuitive and User-Friendly
- • Solves the Pain Point of "Drawing from Scratch"
Specialized Drawing for Specific Fields
Biomedicine & Life Sciences
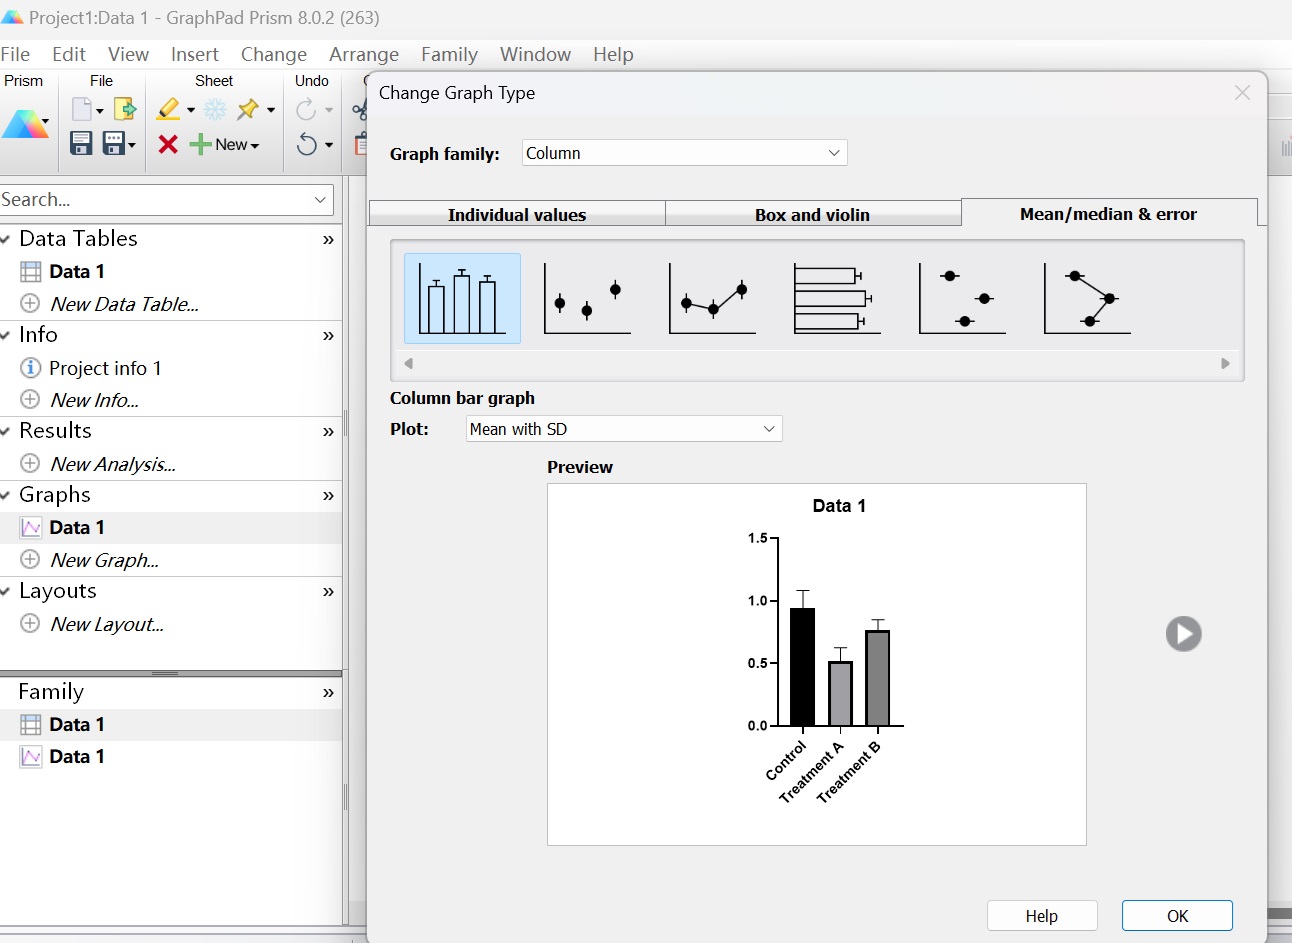
GraphPad Prism: The Gold Standard for Statistics + Plotting
Established as the standard forseamless integration of "Statistics + Plotting"in biomedicine; widely used in high-impact PubMed articles. Users can import raw data to perform t-tests, ANOVA, nonlinear regression, etc., and automatically generate publication-quality figures compliant with international journal standards. [637]
Core Features
- • Wizard-based Interface Reduces Analysis Errors
- • Automatic Annotation of Statistical Results (P-values, Confidence Intervals)
- • Data Table Structures Optimized for Specific Experiment Types
- • "Magic" Feature for Batch Application of Analysis Workflows
Molecular & Structural Visualization
- ChemDraw:Industry Standard for Chemical Structure Drawing, Supports Auto-generation from IUPAC Names
- PyMOL:3D Visualization of Biomacromolecules, Supports PDB Format & Molecular Surface Rendering
- ChimeraX:Immersive VR Structure Exploration, Molecular Dynamics Trajectory Animation
Physics, Chemistry & Engineering
Complex Data Processing
Origin Advantages
Powerful batch processing for massive datasets and advanced algorithms; supports various instrument data formats (XRD, XPS, Raman, FTIR, etc.). [637]
- • Automated Pipelines via Batch Processing Templates
- • Multi-peak Superposition & Global Fitting
- • Baseline Correction & Parameter Extraction
MATLAB Ecosystem
Native matrix computation support and comprehensive toolbox ecosystem; Simulink for dynamic system modeling; DeepMat R2026 integrates Large Language Models. [637]
- • Differential Equation Solving & Optimal Control
- • Real-time Data Acquisition & Processing
- • Natural Language Code Generation
3D Scientific Visualization
ParaView
Open-source, cross-platform data visualization application designed for large-scale scientific datasets; distributed parallel architecture handles billion-level grid cells. [619]
- • Volume Rendering & Slice Extraction
- • Isosurface & Streamline Tracing
- • Custom Algorithms via Python Scripting
WebGL Technology
Three.js and Babylon.js enable interactive 3D visualization in browsers without plugin installation. [642]
- • Molecular Structure Rotation & Zooming
- • Fly-through Navigation of Terrain Data
- • Time-series Animation of Meteorological Fields
Mathematics & Theoretical Computer Science
Precision Typesetting Systems
TikZ/PGF
LaTeX vector graphics macro package enablingcode-driven, high-quality graphic generation, seamlessly integrated with LaTeX math formulas to ensure font and style consistency with body text. [619]
Use Cases
- • Geometric Shapes & Function Plots
- • Algorithm Flowcharts & Complexity Annotations
- • Automata & Formal Languages
- • Combinatorial Structures & Graph Theory Hierarchical Layouts
Proof & Logic Visualization
Professional typesetting for tree proofs, type derivation trees, category theory diagrams, etc., wheresymbol precision and layout standardizationtake precedence over visual aesthetics.
Specialized Macro Packages
- • bussproofs: Sequent Calculus
- • ebproof: Natural Deduction
- • tikz-cd: Commutative & Functor Diagrams
- • xypic: Category Theory Diagrams
Automation & Programming-Driven Plotting
Scripted Workflows
Reproducible Research Principles
Modern research demandsReproducibility, requiring full replication capability including open access to data, code, environments, and documentation.Code as Documentationis the core strategy to achieve this goal. [620]
Core Practices
- • Jupyter Notebook:Integration of Code, Results, and Documentation
- • Binder/Colab:Lowering Barriers to Sharing
- • Externalizing Parameters:Configuration Over Hard-coding
- • Explicit Environment Dependencies:requirements.txt
Batch & Parametric Generation
A key advantage of programming-driven workflows isbatch chart output for multi-condition experiments. Loop structures automatically generate corresponding analysis charts with unified styling themes. [620]
Technical Implementation
- • Theme Consistency:Matplotlib rcParams、Seaborn set_style
- • Parametric Design:Key Parameter Tuning & Exploration
- • Batch Processing:Automated Analysis Workflow Application Across Multiple Datasets
API & Automation Integration
Programmatic API Calls
RESTful API Integration
Real-time data acquisition and visualization made possible: Meteorological data, financial data, and biomedical databases are all accessible via the Python requests library. [619]
- • OpenWeatherMap, ERA5 meteorological data
- • UniProt, PubChem biomedical data
- • Alpha Vantage, Quandl financial data
Direct Database Connection
Drivers such as SQLAlchemy, psycopg2, and pymongo support large-scale data query aggregation and incremental updates.
- • Relational Databases: PostgreSQL, MySQL
- • NoSQL Databases: MongoDB, Cassandra
- • Graph Databases: Neo4j, ArangoDB
CI/CD and Automated Reporting
Continuous Integration Concepts
GitHub Actions/GitLab CI configured for scheduled tasks, triggering the entire workflow of data updates, analysis re-runs, chart regeneration, and report compilation. [352]
- • Scheduled tasks (cron) triggered automatically
- • Semantic versioning management
- • Automatic changelog generation
Chart Version Control
Semantic Versioning implementation: Version numbers increment automatically when data or analysis methods are updated.
- • Major version: Significant algorithm changes
- • Minor version: Dataset updates
- • Patch version: Bug fixes
Collaboration and Sharing Platform Ecosystem
Team Collaboration Features
Real-time Collaborative Editing
MedPeer (Domestic Platform)
Innovatively introduces collaborative drawing features, supporting multi-user co-creation and brainstorming, with over 100,000 vector icon assets. [632]
- • Real-time sync engine and edit locking
- • Comment and annotation system
- • System icons registered with the Copyright Bureau
BioRender (International Leader)
Leading team collaboration features: Role assignment, version history, real-time synchronization. [646]
- • View/Edit/Admin role assignment
- • Version history rollback and time travel
- • Real-time collaboration for distributed teams
Project Management Integration
Banli Kanban
Combines task visualization with research project management, supporting multiple display modes including Kanban views, Gantt charts, and table views. [633]
- • Tracking experiment progress and paper writing status
- • Timeline planning and milestone management
- • Integration with IM tools like Slack and Feishu
Professional Project Management Tools
Provides professional support for research projects of varying scales and complexities. [394]
- • Microsoft Project: Resource integration and scheduling
- • ClickUp/Wrike: Cross-team collaboration
- • Notion: Modular knowledge base tool
Team Collaboration Tool Comparison
| Tool | Core Features | Optimal Team Size | Learning Curve | Cost Structure |
|---|---|---|---|---|
| Banli Kanban | Task visualization, real-time sync | Small teams (<10 people) | Low | Free/Low-cost |
| BioRender | Collaborative drawing, version control, permission management | Research group level (10-50 people) | Medium | Subscription-based |
| Microsoft Project | Resource planning, Gantt charts, critical path | Large projects (>50 people) | High | Commercial license |
| Notion | Knowledge base, document collaboration, database | Flexible | Medium | Free/Team edition |
| ClickUp/Wrike | Multi-view task management, automated workflows | Medium to large teams | Medium-High | Subscription-based |
Cloud and Web Deployment
Advantages of Online Platforms
Zero Installation Barrier
Researchers can access the latest features via a browser without worrying about technical details such as software version compatibility, OS differences, or license server connections. [632]
- • Automatic update mechanism ensures feature synchronization
- • Cloud storage enables multi-device sync
- • Convenience for remote work and business travel
Elastic Computing Power
Large-scale data processing tasks perform the heavy lifting on the server side, while the client side only needs to receive rendered results. [635]
- • Omics data analysis relies on server clusters
- • Cloud acceleration beyond the capability of standard laptops
- • On-demand allocation of computing resources
Data Security and Privacy
Privacy Considerations
Uploading sensitive experimental data (patient information, unpublished data, trade secrets) may violate institutional regulations or ethical requirements. [632]
- • Carefully read the platform's privacy policy
- • Understand data storage locations and access permissions
- • Backup strategies and deletion mechanisms
Enterprise-Grade Solutions
Institutional editions and enterprise-level deployments provide solutions for data-sensitive scenarios, meeting compliance requirements such as HIPAA and GDPR.
- • Private cloud deployment remains within the institutional firewall
- • Flexible configuration with hybrid cloud architecture
- • End-to-end encryption and multi-factor authentication
Academic Social Networking and Result Dissemination
Embedded Sharing
Interactive Charts
Plotly chart HTML/JS export formats support web embedding with preserved interactivity, enabling "living figures". [622]
- • Embedding in personal academic homepages
- • Dynamic display on lab websites
- • Interactive supplementary materials on preprint platforms
Social Media Optimization
Optimized for formats like Twitter Cards, Open Graph protocol, and WeChat Official Account long images to support rapid dissemination of research findings.
- • One-click sharing to major platforms
- • Responsive design adapted for multiple devices
- • Data storytelling narrative templates
Preprints and Open Science
Interactive Supplementary Materials
Platforms such as bioRxiv, medRxiv, and arXiv support hosting interactive supplementary materials, allowing researchers to upload complete datasets and visualization code. [352]
- • Readers can reproduce the analysis workflow
- • Verify research findings and conclusions
- • Facilitate academic exchange and improvement
FAIR Principles
Findable, Accessible, Interoperable, Reusable—Accessibility requirements for chart data mandate open sharing of raw data, analysis code, and visualization scripts.
- • Findable and Accessible
- • Strong Interoperability
- • High Reusability
AI Agent and MCP Server Intelligent Drawing
Multi-Agent Drawing Architecture
PaperBanana Five-Agent System
Jointly developed by Peking University and Google Cloud AI Research, officially open-sourced in February 2026, representingthe cutting-edge architecture of AI-driven research illustration. Its core innovation lies in breaking down complex academic figure generation tasksinto 5 independent specialized agents。 [626]
Evaluation Performance
Reference Retrieval"] B --> B1["RAG Technology"] B --> B2["Top Conference Database"] B --> B3["Structure Matching Strategy"] B1 --> C["Planner
Content Planning"] B2 --> C B3 --> C C --> C1["In-Context Learning"] C --> C2["Structured Visual Layout"] C --> C3["Element Relationship Definition"] B --> D["Stylist
Unified Style"] D --> D1["Top-Tier Conference Aesthetic Guidelines"] D --> D2["Scenario Adaptation Capabilities"] D --> D3["Color/Font/Icon Standards"] C --> E["Visualizer
Image Rendering"] D --> E E --> E1["Dual-Mode Generation"] E --> E2["Methodology Illustrations"] E --> E3["Statistical Charts"] E --> F["Critic
Quality Review"] F --> F1["4-Dimension Assessment"] F --> F2["Iterative Optimization Loop"] F --> F3["Revision Suggestions & Scoring"] F1 --> E F2 --> G["Publication-Ready Figures"] style A fill:#f1f5f9,color:#1e293b,stroke:#64748b,stroke-width:2px style B fill:#e0f2fe,color:#082f49,stroke:#0369a1,stroke-width:2px style C fill:#f0f9ff,color:#0c4a6e,stroke:#0284c7,stroke-width:2px style D fill:#ecfdf5,color:#14532d,stroke:#16a34a,stroke-width:2px style E fill:#fdf4ff,color:#701a75,stroke:#9333ea,stroke-width:2px style F fill:#fef3c7,color:#78350f,stroke:#d97706,stroke-width:2px style G fill:#f0fdf4,color:#14532d,stroke:#16a34a,stroke-width:3px
Dual-Mode Output Strategy
Methodology Illustrations (Image Generation)
Utilizes the Nano Banana Pro diffusion model to achieve visually appealing, professionally laid-out, and creatively flexible generation.
- • Architecture diagrams, flowcharts, mechanism schematics
- • Visually appealing with creative flexibility
- • Professional layout and color schemes
Statistical Charts (Code Generation)
Matplotlib Python scripts ensure numerical precision, reproducibility, and modifiability, eliminating hallucination issues.
- • Bar charts, scatter plots, heatmaps, radar charts
- • Numerically precise and verifiable
- • Code is directly reviewable and editable
Technical Advantages:Diffusion models lack a reliable understanding of precise numerical relationships. The code generation mode separates data processing from visual rendering, fundamentally ensuring the accuracy of statistical charts. [626]
MCP Protocol and Tool Integration
Core Mechanism of Model Context Protocol
Launched by Anthropic in November 2024, it is hailed as"The USB-C Interface of AI"—unified, universal, and plug-and-play. The core design goal of MCP is to solve the "context silo" problem in AI application development. [650]
Three-Role Architecture
- • MCP Host:AI applications containing an MCP Client (Claude Desktop, Cursor IDE)
- • MCP Server:Lightweight standalone process that translates external system APIs
- • MCP Client:Embedded within the Host, responsible for Server discovery and command forwarding
Technical Advantages
-
✓
Streaming-FirstIncremental response mechanism for low latency and high efficiency
-
✓
Protocol ConsistencyInteroperability across different model implementations
-
✓
Security by DesignStrict permission controls and sandboxing mechanisms
-
✓
ExtensibilitySeamless integration of future features
MCP Host"] --> B1["github-server
MCP Server"] A --> B2["postgres-server
MCP Server"] A --> B3["custom-server
MCP Server"] B1 --> C1["GitHub API"] B2 --> C2["PostgreSQL DB"] B3 --> C3["Internal System"] C1 --> D1["Repository Data"] C2 --> D2["Database Records"] D3 --> E["LLM Context"] D2 --> E D3 --> E E --> F["Intelligent Decision-Making"] F --> G["Tool Calls"] G --> B1 G --> B2 G --> B3 style A fill:#0f172a,color:#ffffff,stroke:#475569,stroke-width:3px style B1 fill:#1e40af,color:#ffffff,stroke:#3b82f6,stroke-width:2px style B2 fill:#059669,color:#ffffff,stroke:#10b981,stroke-width:2px style B3 fill:#7c2d12,color:#ffffff,stroke:#ea580c,stroke-width:2px style E fill:#7c3aed,color:#ffffff,stroke:#a855f7,stroke-width:2px style F fill:#dc2626,color:#ffffff,stroke:#ef4444,stroke-width:2px style G fill:#f59e0b,color:#ffffff,stroke:#fbbf24,stroke-width:2px
Synergy Between MCP and Agent Skills
Relationship Positioning:MCP and Agent Skills represent a collaboration between the capability layer and the workflow layer, rather than competitive substitutes. Anthropic's hardware store analogy: MCP is the aisle shelving system, while Agent Skills are the employees' specialized knowledge. [629]
Collaboration Examples
- • Financial Analysis:Skills define the methodology; MCP provides data access
- • Meeting Intelligence:Skills define search strategies; MCP handles CRUD operations
- • Multi-Server Coordination:Skills orchestrate workflows across multiple data sources
Capability Layer (MCP)
Defines what an Agent "can do": tool invocation, data access, operation execution
- • MCP Tools: Actions the Agent can execute
- • MCP Resources: Context the Agent can read
- • MCP Prompts/Commands: Explicit user invocations
- • Rules: Invariants that always apply
Workflow Layer (Agent Skills)
Defines how an Agent "does it": workflow steps, domain expertise, constraints
- • Agent Skills: Workflows, expertise, step-by-step guidance
- • Subagents: Parallel workflows and isolated contexts
Rule of Thumb:"MCP instructions cover how to correctly use a server and its tools; Skill instructions cover how to use them within a given process or multi-server workflow."
Agent Development Frameworks
Mainstream Framework Comparison
| Framework | Core Positioning | Architectural Features | Best Use Cases | Learning Curve |
|---|---|---|---|---|
| LangChain/LangGraph | Modular general-purpose LLM application development | Component-based Chains/Graphs, state machine-driven | Rapid prototyping, feature-rich agents with complex states | Moderate |
| LlamaIndex | Data-centric RAG applications | Complete pipeline for data ingestion, indexing, and querying | Private knowledge base queries, literature comprehension, data retrieval | Moderate |
| AutoGen | Multi-agent dialogue and collaboration | Customizable agent roles, natural language messaging | Multi-role coordination, autonomous task allocation, complex workflows | High |
Evolution Trends of Research Illustration Agents
Current Capability Boundaries
Performance Evaluation
PaperBanana achieved a 72.7% blind evaluation win rate on a benchmark of 292 NeurIPS 2025 paper illustrations, but content fidelity still requires human oversight. [626]
Core Bottlenecks
- • Precise understanding of complex spatial relationships (molecular stereochemistry, circuit topology)
- • Accurate rendering of scientific symbols (mathematical formulas, chemical structural formulas)
- • Strict adherence to domain-specific standards (journal formatting requirements)
Future Directions
Technology Integration
- • Domain-Specific Language Models (DSLM)Deep integration with biomedical knowledge
- • Embedding structured knowledge bases (Gene Ontology, Cell Ontology) into reasoning
- • Automation of end-to-end research workflows: Literature → Design → Analysis → Figures → Paper
Human-AI Collaboration
- • AI handles tedious execution tasks (asset searching, layout adjustments)
- • Humans focus on conceptual design and scientific judgment
- • Critic agent iterative optimization mechanisms foreshadow future workflows
2026 is predicted by the industry to bethe pivotal year for the full-scale deployment of multi-agent systems, as supporting technologies such as agent control planes, A2A communication protocols, and agent payment protocols mature, accelerating this transformation. [479]
Tool Selection Decision Framework
Tiered by Skill Level
Beginner-Friendly
BioGDP
10,000+ original assets, 200+ top-journal templates, officially licensed [647]
- • Mechanism diagrams, pathway maps, schematics
- • Extremely low learning curve
- • Early-stage researchers in biomedicine
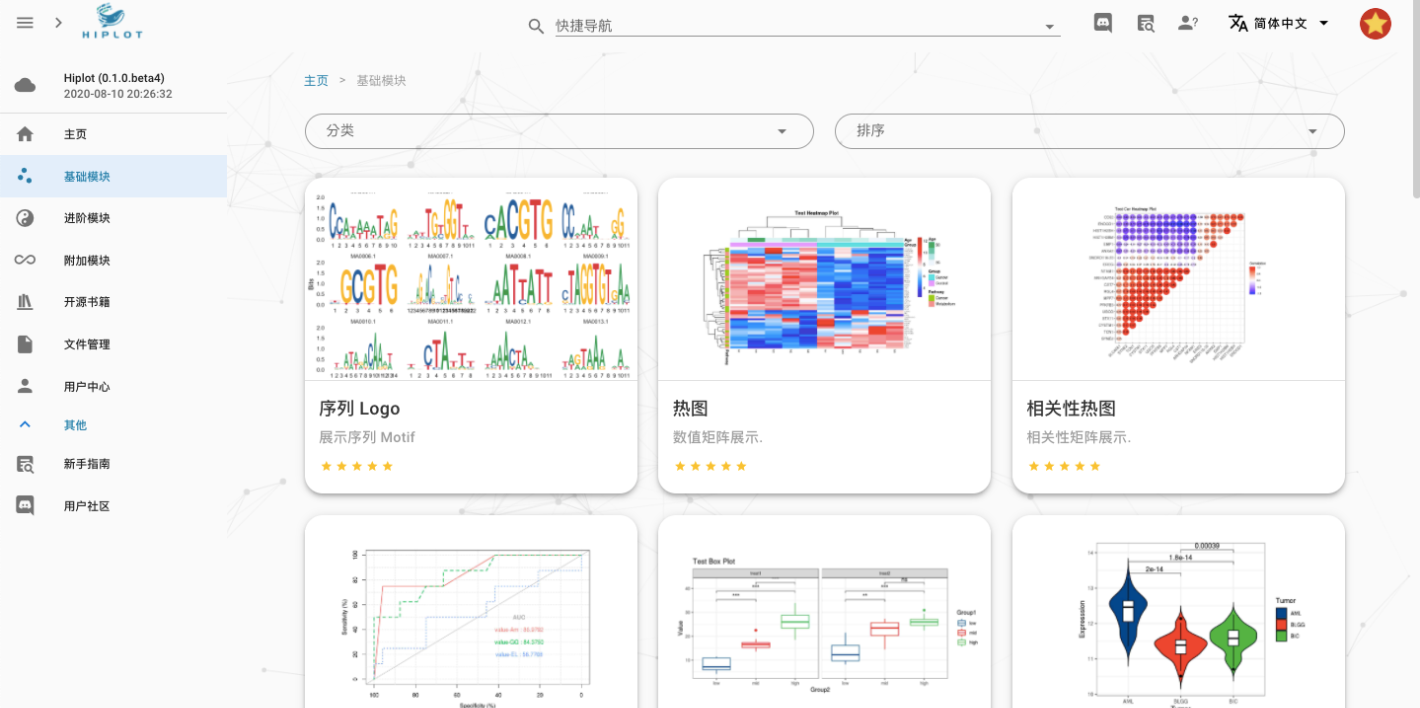
Hiplot
200+ visualization charts, built-in medical statistics module, free [635]
- • Volcano plots, heatmaps, network graphs, survival curves
- • Low learning curve
- • Clinicians, epidemiology researchers
PicDoc
One-click AI generation, zero barrier to entry, optimized for Chinese [646]
- • Pathway maps, experimental flowcharts, data visualization
- • No learning curve
- • Time-constrained researchers without design backgrounds
Common Features:Ready-to-use, template-driven, and optimized with a Chinese interface, reducing professional illustration tasks that originally took hours down to minutes.
Advanced Professional
GraphPad Prism
Seamless integration of statistical analysis and graph generation [637]
- • t-tests, ANOVA, survival analysis, nonlinear regression
- • Requires basic statistical knowledge
- • Statistical analysis of biomedical experimental data
Origin
Massive data processing, nonlinear fitting, SCI top-journal standard output [637]
- • Curve fitting, peak analysis, signal processing, batch plotting
- • Requires mastery of software logic and advanced features
- • Complex interdisciplinary data in physics, chemistry, and biology
Return on Investment:Built-in support for journal standards reduces post-processing adjustments; educational licenses and lab group purchasing plans keep commercial software costs manageable.
Expert Customization
Adobe Illustrator
Industry-standard vector design with refined layout and color schemes [619]
- • Infinite scalability and high-quality composite figure layout
- • Requires design fundamentals, including mastery of the Pen tool and color theory
- • Complex interdisciplinary charts, journal covers, and top-tier journal figure polishing
MATLAB
Advanced modeling & simulation, algorithm development, and 2D/3D charting [637]
- • Differential equation solving, signal processing, and image analysis
- • Requires programming fundamentals and mathematical modeling skills
- • Quantitative research and dynamic simulation in bioengineering and neuroscience
Python/R Programming
Highly programmable, integrated scientific computing ecosystem, and interactive visualization [619]
- • Batch generation, version control, and automated pipelines
- • Requires software development skills and version control practices
- • Long-term research projects requiring frequent data updates
Core Challenges:Integrating and maintaining the tech stack requires ongoing engineering investment, but the payoff is limitless customization—any visual concept can be realized, and any analytical workflow can be automated.
Matching by Application Scenario
Data-Driven Research
Forstatistics-drivenresearch projects (clinical trials, epidemiological surveys, omics data mining), you shouldprioritize programming tools。 [620]
Recommended Tools
- • Python(Matplotlib/Seaborn/Plotly)
- • R(ggplot2)
- • Integrated analysis via Jupyter Notebook
- • Version control ensures transparent collaboration
Core Advantages
- • Comprehensive coverage of statistical methods
- • Guaranteed reproducibility of results
- • Seamless integration of exploratory analysis and reporting
- • Automation benefits for high-frequency updates
Mechanism Diagrams
Conceptual and explanatory mechanism or pathway diagrams(signaling pathway hypotheses, theoretical frameworks, technical workflows) are best suited to aAI-generated draft + vector editing refinementcombined strategy. [636] [646]
Recommended Combination
- • BioRender/PicDoc for initial drafts
- • Adobe Illustrator for final polishing
- • Balances efficiency and quality
- • Standard practice in biomedical fields
Workflow
- • AI tools rapidly produce compliant drafts
- • Vector editing software enables detailed adjustments
- • Multi-figure layout with unified styling
- • Final output at top-tier journal quality
Complex Interdisciplinary Projects
For complex projects involvingmultiple disciplinary methods and diverse data types,Origin's multidisciplinary adaptability + AI Agent-assisted generationoffers the optimal balance. [637]
Optimal Combination
- • Origin for experimental data statistical analysis
- • AI Agent (PaperBanana) accelerates diagram generation
- • Researchers focus on scientific judgment and innovative thinking
- • Maximizes toolchain synergy and efficiency
Success Factors
- • Team technical expertise and standardized workflows
- • Clear division of labor and collaboration mechanisms
- • Quality control and version management
- • Continuous optimization and experience accumulation
Cost & Licensing Considerations
Free Open-Source Combination
Zero-cost complete toolchain
The free version of BioGDP + Hiplot + SciDraw + Inkscape + Python scientific computing ecosystem constitutes acomplete solution covering approximately 70% of functional needs. [635] [647]
Functional Gaps:Guided statistical analysis (Prism's selling point), advanced 3D rendering (Origin/MATLAB strengths), and collaboration features (BioRender Team Edition).
Commercial Licensing Strategies
Educational Institution Licenses
Software such as Origin, MATLAB, and Adobe Creative Cloud offers educational licenses priced at approximately 40–60% of commercial rates
Lab Group Purchases
GraphPad Prism and BioRender Team Edition offer lab group purchase plans, with per-user costs decreasing as scale increases
Team/Enterprise Editions
For research groups requiring collaboration features and permission management: weighing feature premiums against efficiency gains
On-Demand AI API Calls
Generative services like Nano Banana Pro cost $0.05/image, as low as 20% of official pricing [626]
Copyright Risks:Using unauthorized assets or software may lead to severe consequences such as paper retraction or legal disputes. Professional illustration platforms provide licensing documentation to ensure submission compliance.